orly
Please check with me for Blammo criteria
It's pie chart or nothing for me. Get your bars out of my face
GIVE US MORE PIE YOU BIFFS
It's pie chart or nothing for me. Get your bars out of my face
...is the correct answer.It's pie chart or nothing for me. Get your bars out of my face
It's pie chart or nothing for me. Get your bars out of my face
Deal with the facts son
Facts are circular Chris, not rectangles
A pie chart for you chumps is going up tonight
Ha Ha.
Start it from 2013/14 and then get back to us.
Surely start the year before that Christopher?The busy festive season passes us by I thought I would gather some figures to show the radical improvement the Ronkster as given us. The fitness levels seems to be improving and our output is increasing.
We can clearly see from the below figures improvements all round; goals scored is up on comparison with the previous 2 years and our defensive record as massively improved, conceding less than a goal a game. This winter period (Dec-Jan) as seen us face 4 of the top 6, only the RS taking 3 points from us in a last minute snatch and grab. Goals scored is just shy of 2 per game giving us GD of +9.
Evidence to the doubters that Everton are on the UP
C’MON ON YOU BLUES
View attachment 34054
Depends what the purpose of the research is:Just like a Liverpool fan, always harping on about the distant past.
Surely start the year before that Christopher?
Depends what the purpose of the research is:
If it's to show a trend over a fixed period, fair enough.
If it's a comparison against the previous management, all data should be included.
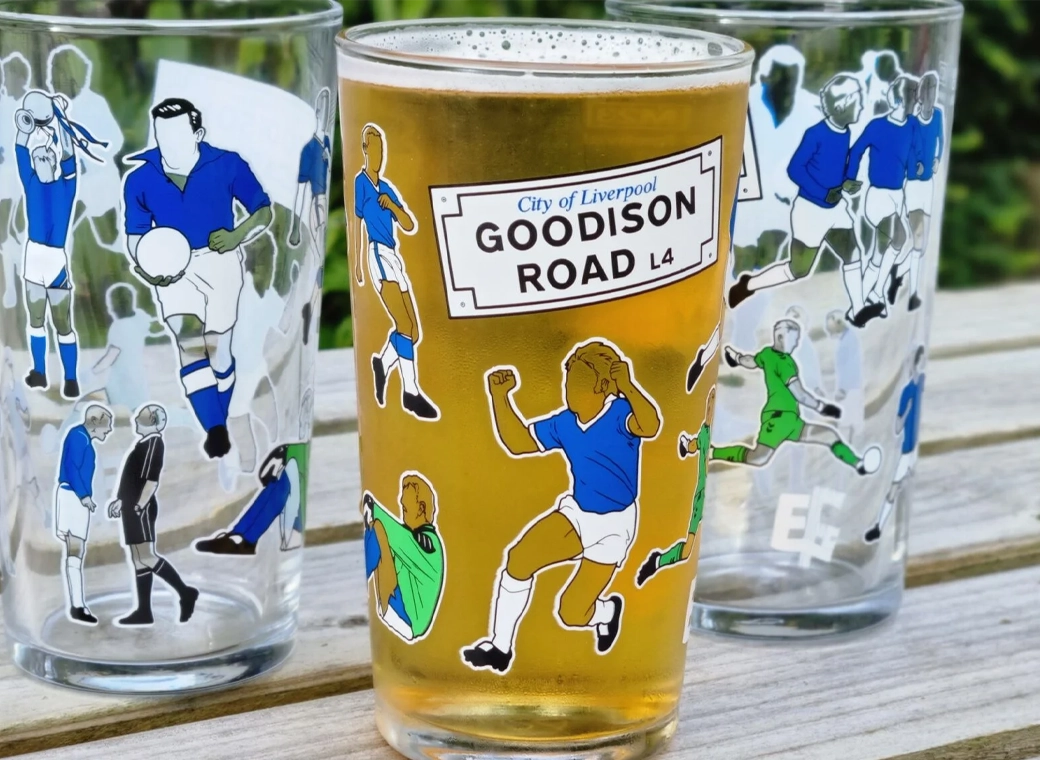
Our exclusive Everton pint glasses are a true collector’s item that pays homage to Goodison Park through iconic players who have graced the pitch over different generations.
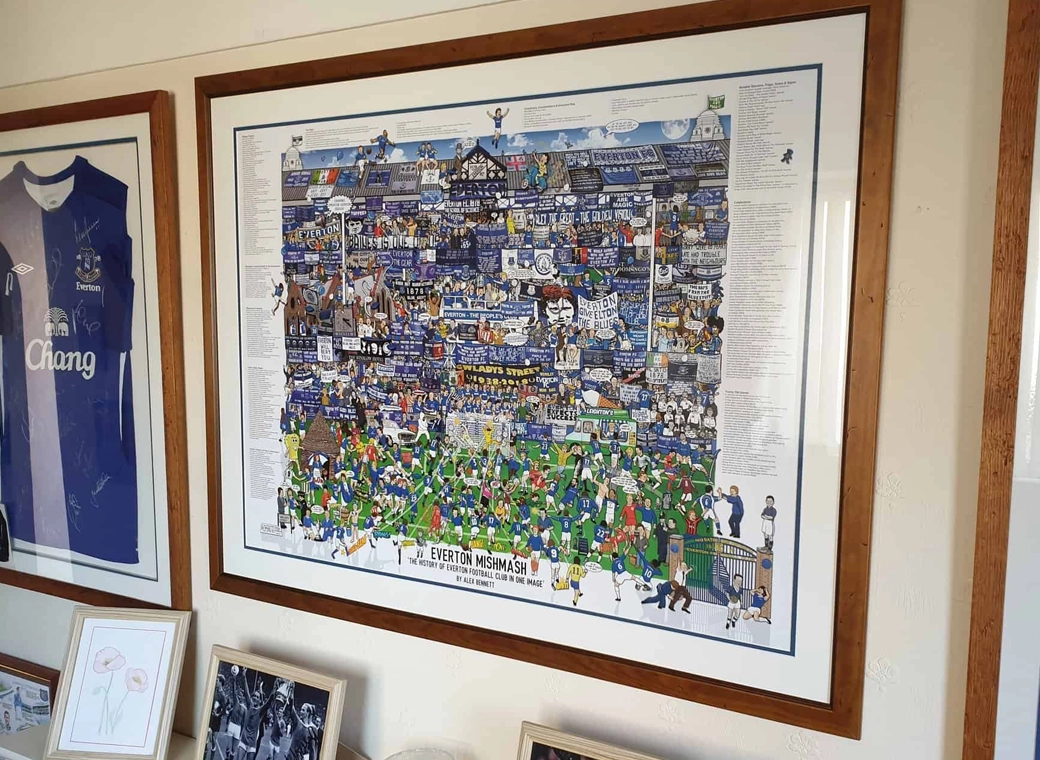
The history of Everton FC in one image! “The best Everton thing I’ve ever got!”
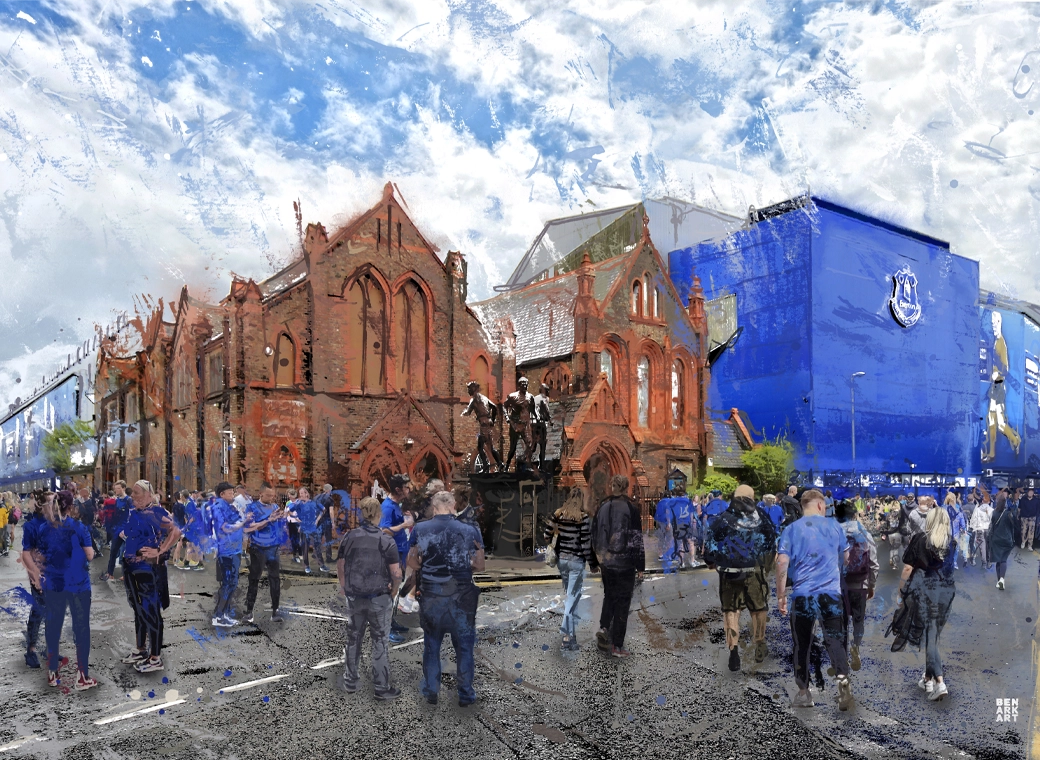
A truly, wonderful piece which brings memories of visits to Goodison Park alive.
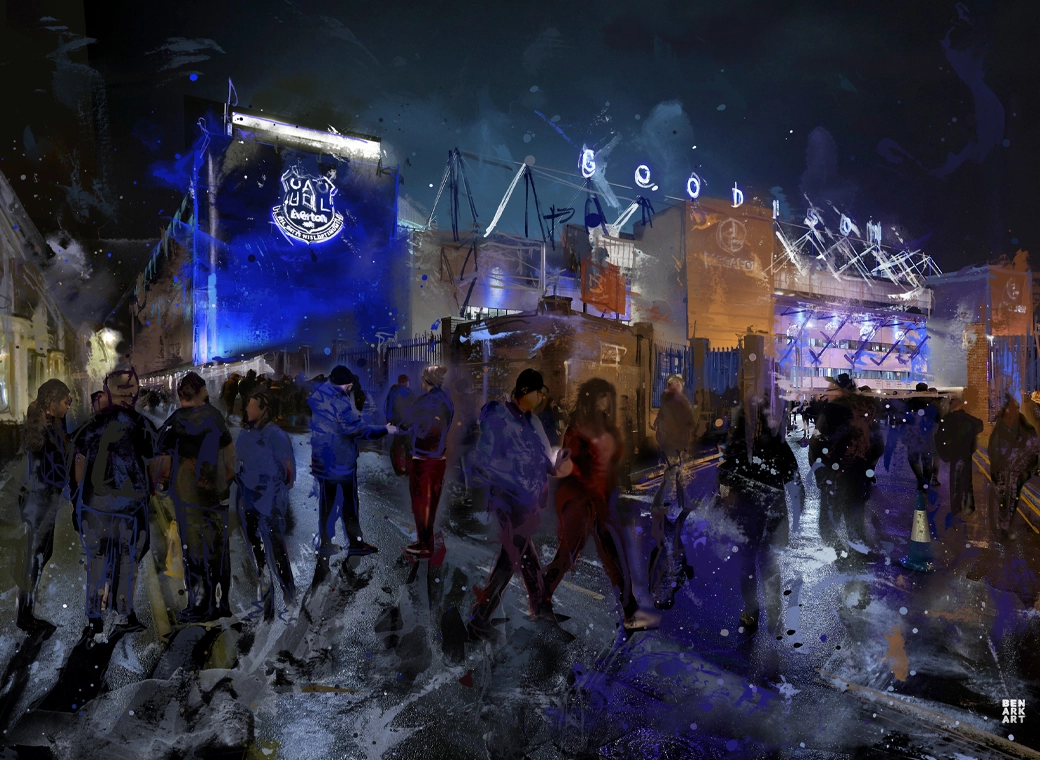
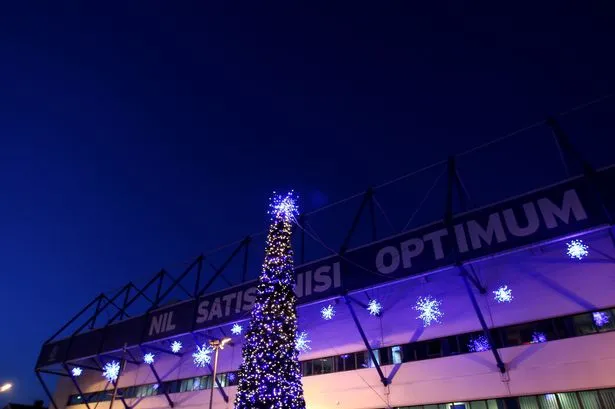
This print wonderfully encapsulates the magic of the ‘Goodison Under The Lights’.
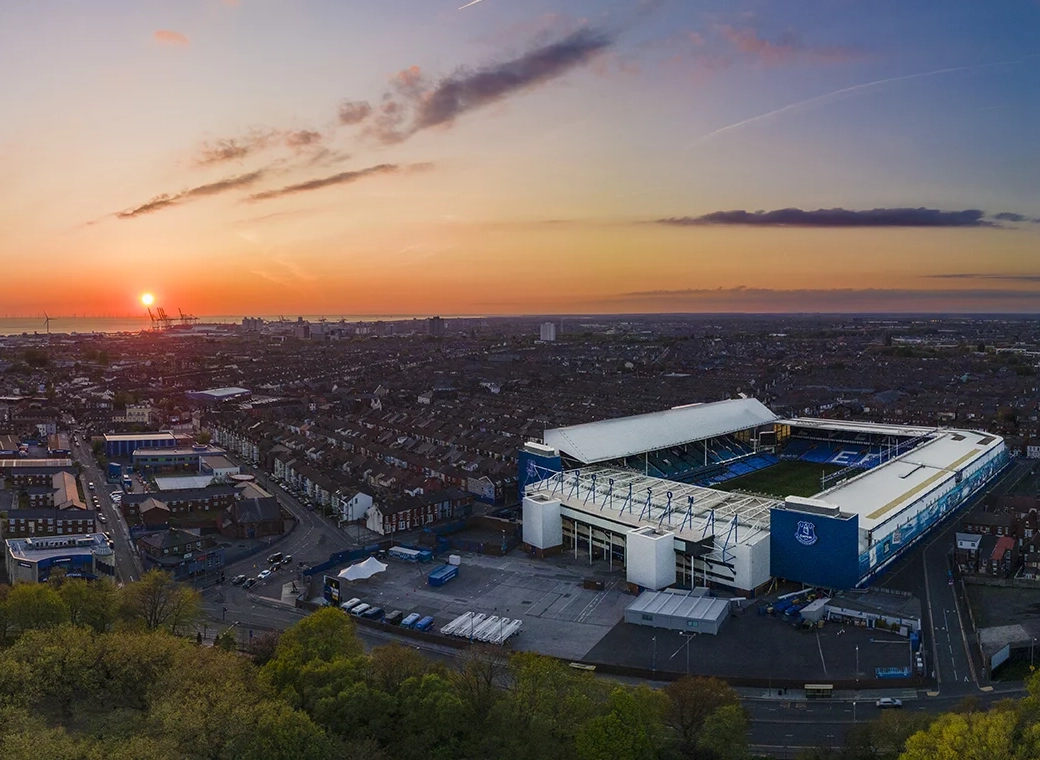
A wonderful, A3 aerial print of Goodison Park.
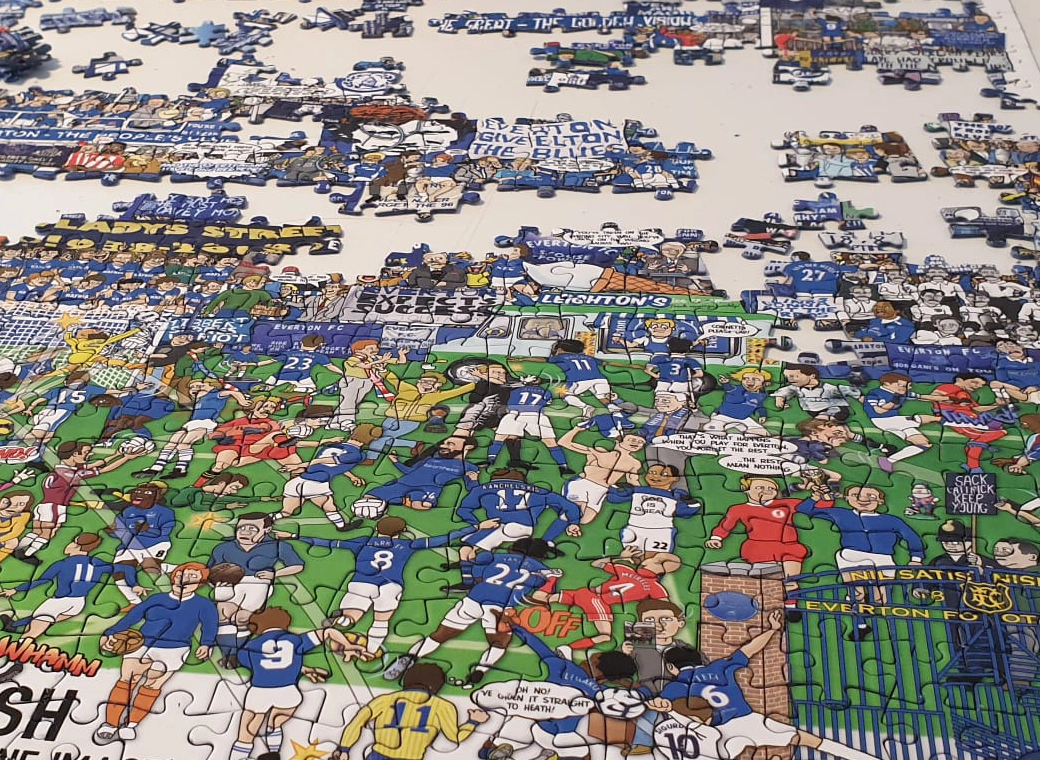
A special, limited edition 1,000 piece jigsaw of the popular Everton Mishmash – The History Of Everton FC In One Image!
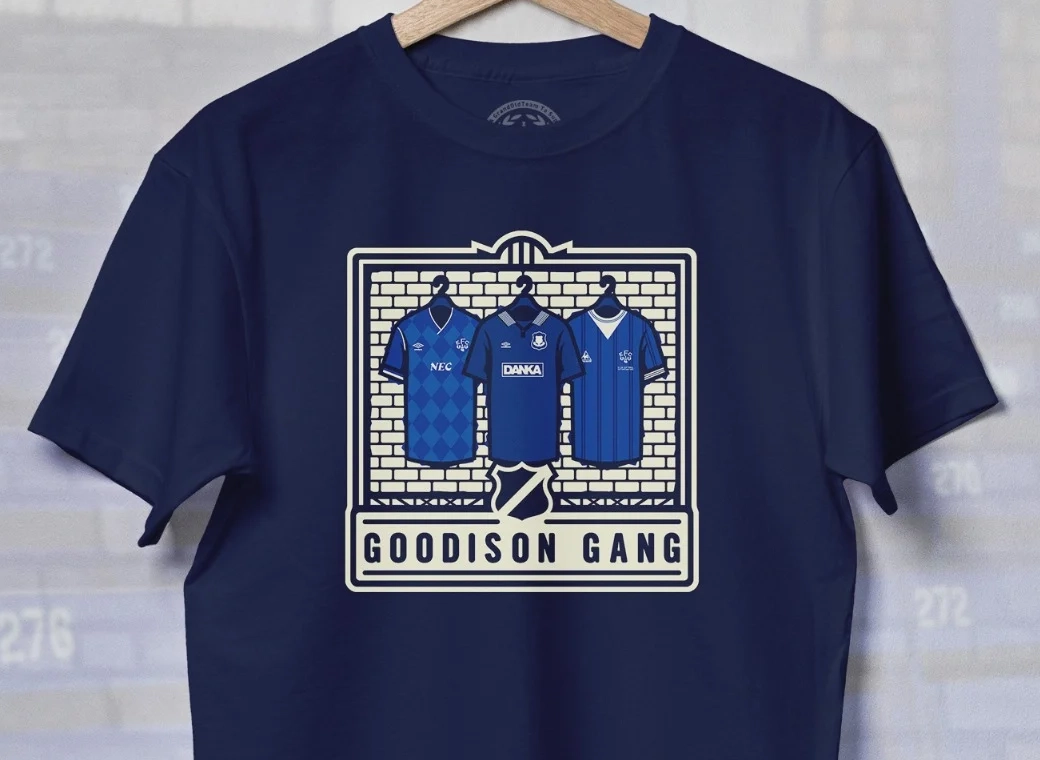
Introducing our Goodison Gang Everton T-Shirt.
Our newest Everton T-Shirt.
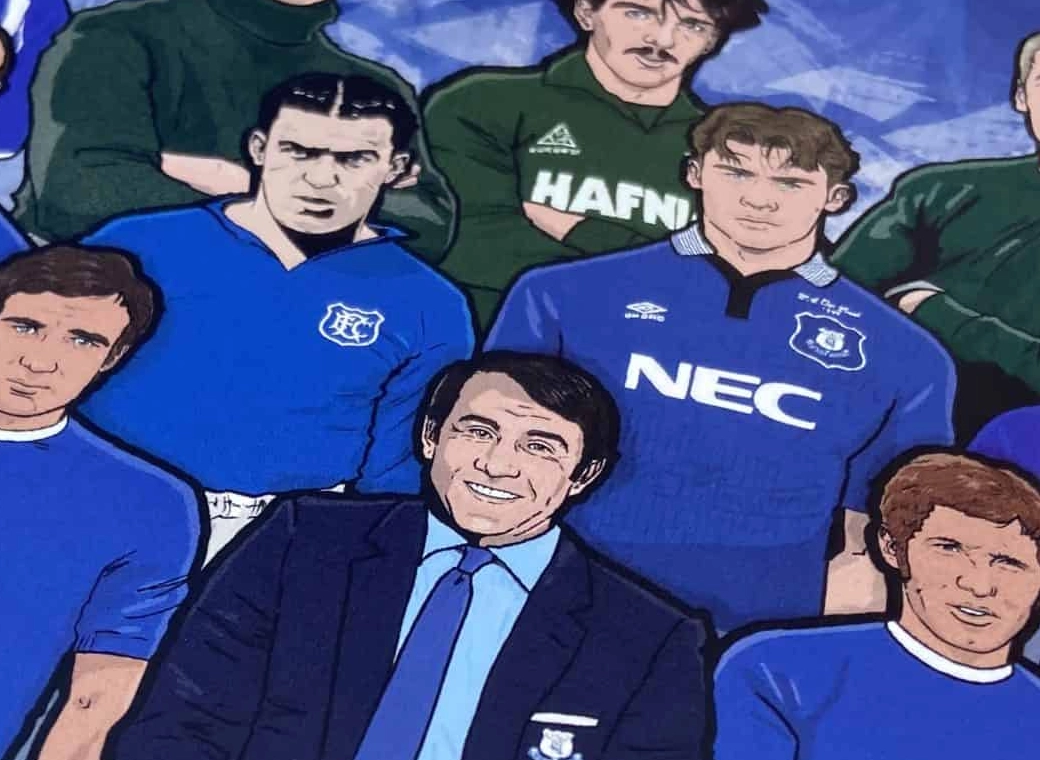
Everton champions, legends, and long-time servants assembled together in one squad photo!