The Numbers
In this article, I’m going to crunch some numbers from this season, as well as the previous 4, to provide a bit of context and to gauge the extent of the progress made under David Moyes.
I’m going to distinguish between actual and expected (or deserved) outcomes*, before considering our rankings in the league over a range of metrics (including squad value, wage expenditure, etc) in order to give a well-rounded overview of what has happened, what should have happened, and what we may realistically have expected to happen before a ball was kicked.
* I appreciate the likely scepticism toward the use of ‘expected’ metrics, such as expected goals or expected points, but these are important, as they tell us more about actual performances than goals or points alone. Football is a low-scoring game, meaning single goals (which are ‘random’, or ‘noisy’, in statistics lexicon) have a large bearing on outcomes, and therefore luck plays a big role in determining outcomes. Analysing xG and related stats across seasons is, therefore, more informative if we want to objectively judge performance, rather than outcomes, alone.
Outcomes – What Happened?
| Season | Points | Position | Goals | Goals Against |
| 2021/22 | 39 | 16 | 43 | 66 |
| 2022/23 | 36 | 17 | 34 | 57 |
| 2023/24 | 48 | 12 | 40 | 51 |
| 2024/25 | 48 | 13 | 42 | 44 |
| 2025/26 | 49 | 13 | 47 | 50 |
2025/26 is being lauded as a season of progress by many, and, in terms of points earned and goals scored, there is some merit to these claims. In the past 5 seasons, too, only in 2024/25 did we concede fewer goals than this season.
So, does this represent progress?
In the chart below, I’ve indexed all the values to the 2021/22 season, and inverted the league positions and goals against, so that higher values represent better outcomes for all metrics. Now, all metrics are on the same scale, so we can look at how things have changed since then.
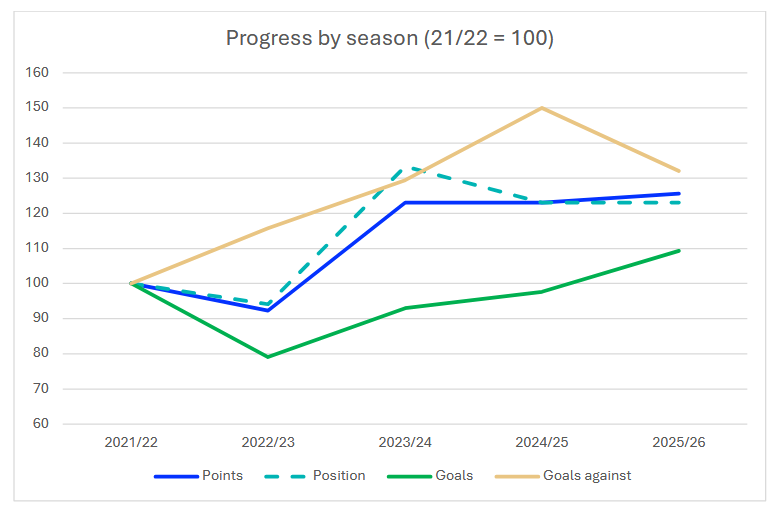
Thankfully, things are better now than they were in 2021/22 and 2022/23. I’m sure I don’t need to remind anyone that these were dark times, when we were on the brink of relegation. 2023/24 was different, as we had 10 (later reduced to 8) points taken away from us, so, although the Premier League table will tell you we finished on 40 points, we earned 48 (which is what I’m using above and in what follows), and as you can see, our points total, position and goals conceded all improved dramatically.
Since then, though, things have stagnated somewhat. The past 3 seasons have seen us score iteratively more goals, but on goals conceded, position and points, we’ve remained where we are, give or take.
Therefore, whether this represents progress or not depends largely on how you define progress and what your reference point is. If that reference point is the depths of the 21-22 and 22-23 seasons, then yes, we’ve progressed. If you’d rather judge this season on the last 3, during which the threat of relegation wasn’t quite so menacing, however, that progress becomes a bit more modest, if, indeed, you consider an additional point and a few more goals progress at all.
This leads me to performance metrics.
Performance – What Did We Deserve?
This is where things get interesting…
| Season | Expected Goals | Expected Goals Against | Expected Points | Expected (Deserved) Position |
| 2021/22 | 44.47 | 60.69 | 43.54 | 13 |
| 2022/23 | 48.65 | 68.58 | 40.71 | 14 |
| 2023/24 | 60.75 | 60.26 | 53.1 | 10 |
| 2024/25 | 46.87 | 53.66 | 47.65 | 15 |
| 2025/26 | 49.87 | 59.99 | 46.17 | 14 |
These metrics provide more information about our underlying performance, without the influence of luck. For those who are sceptical or unsure, here is a quick rundown of what each one is:
- Expected goals: This is the number of goals a team would be expected to score, based on the shots they’ve taken throughout the season. It is calculated using historical data on thousands of shots from similar areas of the pitch, with similar conditions (defender positions, goalkeeper position, ball control [bouncing, in the air, etc.], strong/weak foot, and so on). For example, out of 1000 shots from a particular point on the pitch, if 240 resulted in a goal, then a team taking a shot from this area on the pitch would accrue 0.24xG. Similarly, around 77% of penalties are scored, so a penalty earns a team 0.77xG.
- Expected goals against: This is the number of goals a team would be expected to concede based on the quality of the chances they have allowed the opposition over the course of the season.
- Expected points: Based on xG for and against in each individual game, simulations are run to calculate the average outcome of the game if it were played, say, 10,000 times. The average number of points each team earns based on these simulations (based on the net quality of chances created vs let up) is their expected points total. When this is added up over the course of a season, it can be thought of as the points a team deserves to have, and the league table based on this metric is often called a justice table.
- Deserved position: Based on expected points, where each team ‘deserves’ to place in the table.
Bad finishing, opposition goalkeepers playing out of their skin, or both?
Ask any Evertonian the last time they were happy with their striker, and most will probably mention Romelu Lukaku. It has been no secret that we’ve struggled up top over recent years.
| Season | Expected Goals | Goals Scored | Difference |
| 2021/22 | 44.47 | 43 | -1.47 |
| 2022/23 | 48.65 | 34 | -14.65 |
| 2023/24 | 60.75 | 40 | -20.75 |
| 2024/25 | 46.87 | 42 | -4.87 |
| 2025/26 | 49.87 | 47 | -2.87 |
As this table shows, in each of the last 5 seasons we’ve underperformed our xG. In 22/23 and 23/24, we were the largest underperformers in the league. This can be interpreted in different ways.
Either opposition goalies choose to have the games of their lives when they play us (I can think of plenty of cases where this is true – Emi Martinez at the Hill Dickinson, for example), or our finishing just isn’t up to scratch.
Given the persistence of the issue across seasons, it seems far more likely that the latter is the issue; if you’re consistently scoring fewer goals than you should, then the finger has to be pointed at your strikers. I’m sure this shocks no one.
You would hope, though, even with limited strikers, that if you create more chances, you’ll score more goals. Indeed, all a manager can do is set a system to get his players in the positions to score; he can’t control whether they take those chances or not.
So, are we creating more chances?
There is a clear outlier in that table: the 2023/24 season. Bear this in mind, as I’m going to come back to it later.
23/24 aside, our chance creation really hasn’t changed that much. Granted, we’d be expected to score 3 more goals this season than last, but with the money spent in the summer and the threat of relegation almost non-existent, is this enough of an improvement?
Let’s switch focus to the defence.
Jordan Pickford really is dynamite…
| Season | Expected Goals Against | Goals Conceded | Difference |
| 2021/22 | 60.69 | 66 | 5.31 |
| 2022/23 | 68.58 | 57 | -11.58 |
| 2023/24 | 60.26 | 51 | -9.26 |
| 2024/25 | 53.66 | 44 | -9.66 |
| 2025/26 | 59.99 | 50 | -9.99 |
In each of the last 4 seasons, we have conceded around 10 fewer goals than we should’ve, based on the quality of chances the opposition has created. Once again, there is more than one interpretation. Are strikers having bad days against us, have they been unlucky, or has Jordan Pickford consistently bailed us out?
Again, due to the consistency in the difference between expected and actual goals against, it looks like more than a mere coincidence or luck. Our defence has earned a lot of plaudits over recent seasons, and rightly so, but the stats show that, with the exception of 24/25, we’ve allowed teams chances such that they should have scored around 60+ goals.
Now, allow me to provide some context to all of the above. Much can be said of the progress we have or haven’t made over recent seasons just from looking at points, goals and performance. But football isn’t always as ‘black and white’ as that, so these figures shouldn’t be considered in isolation.
Are we punching upwards?
Studies have shown that success in the Premier League is closely linked to financial power. Clubs that spend more on wages tend to attract better players, and better players usually translate into better results on the pitch. In simple terms, investment in squad quality often buys success – allowing wealthier clubs to sustain or build upon their advantage over time. Well-known sports economists Stefan Szymanski and Simon Kuper have also shown that wage bills explain the vast majority of variation in league position.
Therefore, based on our wage expenditure, should we be doing better?
| Season | Position | Deserved Position | Wage Rank |
| 2021/22 | 16 | 13 | 7 |
| 2022/23 | 17 | 14 | 8 |
| 2023/24 | 12 | 10 | 10 |
| 2024/25 | 13 | 15 | 10 |
| 2025/26 | 13 | 14 | 12 |
Not once in the past 5 seasons have we finished in line with our wage expenditure rank in the Premier League, and only in 2023/24 did we deserve to. This tells me we’re either paying our players disproportionately high wages, or that we’re not using them effectively (or perhaps both are true).
From a financial standpoint, the fact that we’ve lowered our wage expenditure (at least in relative terms) over the past 3 seasons could be seen as a step towards a more sensible long-term model. Offloading some highly paid players who weren’t doing it for us has likely played a big role in achieving this, and I don’t think anyone will argue with that.
We know all too well the dangers that come with spending money carelessly. With this in mind, this point about wages and performance represents something of a dilemma for Everton. What comes next?
There is an argument that if we want to be a big club, we need to behave like a big club, and in this case, that might mean paying the wages to compete with the big boys. The problem with this is that, for it to work, we need to make sure we sign the right players to justify the money, or else we could find ourselves in trouble again. Spending more on players also means we may not be able to sign as many, and I think it is clear that this current squad needs improving both in terms of quality and size.
However, exceptions to this rule exist. The charts below show the difference between each Premier League side’s wage rank and league position (or deserved league position in the second one).
As discussed earlier, teams don’t always get what they deserve in football. A season provides a small enough sample of games for luck to affect outcomes, and Villa and Sunderland are proof of that this season. Both finished higher than they deserved to, according to xG, and both are playing European football next season as a result (of course, Villa won the Europa League, so their league standing isn’t as important in this sense). In a perfectly fair world, where chances are taken consistently, Sunderland would have found themselves heading back to the Championship. Instead, their fans have Europa League football to look forward to.
Brentford, Bournemouth and Brighton each make a mockery of this wage rule. Brentford pay the lowest wages in the entire league, and yet they should be playing in Europe next season. Convention would predict them to be relegated every season they play in the Premier League, and yet they defy it year in, year out, prevailing despite constantly losing their best players and their manager to bigger clubs. Bournemouth and Brighton will be playing European football next season. All three clubs feature in the bottom 5 in the Premier League in terms of wage expenditure.
Surely, for a club in Everton’s position, these are the clubs to follow. Each relies on cutting-edge data and statistics to give them an advantage, and they sign players that the big clubs aren’t even looking at. They sign undervalued players on the cheap; these players improve them; they sell these players for a huge profit; then, they sign even better ones – Moneyball style. That is what you call stability.
And as for their managers, neither club has an A-lister in charge. They look far and wide to find enthusiastic, driven, forward-thinking managers who buy into the idea and want to drive the clubs forward. Managers who aren’t afraid of challenging the big teams, playing attacking football, imposing a style, and making changes before 60 minutes.
Would they fare so well if their respective clubs weren’t set up so well from top to bottom? Probably not, but they show what can happen when ownership, scouts, coaches, managers and players are aligned.
Now, imagine Everton were to copy this model, hire a manager of this ilk, and build a sustainable model around them. We have a stunning 52,000 seater stadium, which none of these clubs has. We have commercial potential which surely blows each of these clubs out of the water. On top of all this, we have a fanbase whose passion is unrivalled anywhere in the country, and who will back a team and manager to the hilt if it sees even a glimmer of a plan or direction.
The final word: Another non-descript season
At face value, all else being equal, for a prospective signing, the choice of joining Everton, Bournemouth, Brentford or Brighton should be a no-brainer. All else isn’t equal, though. We trail these clubs in our adoption and use of data and statistics, and perhaps in our ambition, too. Brentford benefits from Matthew Benham’s expertise and has immediate access to data from Smartodds, which they utilise expertly. Brighton has Tony Bloom’s Starlizard/Jamestown Analytics, which went a long way, in a single summer window (no 2-summer-window plan?!), toward toppling the long-standing Old Firm dominance in Scotland. We don’t have that.
We may not need it, though. Brighton and Brentford succeed because they are headed by two clever, data-savvy people who constantly look for ways to gain an advantage. You don’t have to own a gambling firm to have that trait. You don’t even need to like, or know anything about football! Football is heading in this direction whether we like it or not, and the sooner we get ahead of the curve, the better. This is a change that has to happen from the top down, so it would not be quick to implement.
What we can do in the shorter-term, though, is hire a manager who gets the best out of what he has. The stats suggest David Moyes is not doing that. Frankly, we are a big club that should, at present, be performing like a mediocre mid-table club, but instead are performing like a smaller, lower-mid-table club.
I’ve tried to stick to the data here and to be objective, but anyone with two working eyes will no doubt have been enraged at one point or another this season over the lack – or delaying – of substitutions. The data backs this up. We used the fewest players (22), fewest subs (128) and gave those subs the least time (15 minutes on average) of any club in the Premier League this season. For context, Brighton and Bournemouth made the 2nd and 4th most subs in the league, respectively. We can debate whether this is stubbornness, ignorance, a lack of faith in the squad, a blindness to the shifting momentum in games, or any combination of an endless list of potential reasons. The fact of the matter is, we’re overusing a small core of our squad and underusing the rest, in an age where games come thick and fast. [Ironically, I wish we would use our first 11 in cup competitions to try to end the trophy drought, but I digress.]
Progress?
I would call into serious question the many claims from fans – and our CEO – that this season represents progress. We’ve 1 more point on the board, have scored 5 more goals and conceded 6 more.
As the table below shows, our squad value has increased relatively more from last season than any other club’s (among those who were in the Premier League in 2024/25), increasing by 24%. This has corresponded to a 2% increase in our points total. I appreciate that football doesn’t work like this, but that corresponds to 87.2 million euros per point gained. Hardly efficient, is it?
| Club | Change in Value (%) | Change in Points (%) |
| Everton | 24% | 2% |
| Nottingham Forest | 18% | -32% |
| Brentford | 10% | -5% |
| Liverpool | 7% | -29% |
| Fulham | 7% | -4% |
| Arsenal | 6% | 15% |
| Newcastle | 5% | -26% |
| Tottenham Hotspur | 3% | 8% |
| Crystal Palace | 3% | -15% |
| Bournemouth | -2% | 2% |
| Chelsea | -3% | -25% |
| Manchester City | -4% | 10% |
| West Ham | -9% | -9% |
| Manchester United | -9% | 69% |
| Aston Villa | -20% | -2% |
| Brighton | -26% | -13% |
| Wolves | -36% | -52% |
Asked, following the Tottenham game, whether he understood the fans’ frustrations, David Moyes quite dismissively claimed not to understand it, before stating that we’ve ‘made some small steps in a good direction’ and ‘done pretty well’. He then claimed that the squad had been ‘squeezed’ around January, seemingly using AFCON, as well as Jarrad Branthwaite‘s injury, as an excuse for some of our poor form.
I would argue that injuries and other absences make the lack of use of the wider squad all the more bewildering. Sunderland, who have qualified for the Europa League, were worse hit than anyone during AFCON, remember.
He was hailed as the Moyesiah last season for the role he played in steering us safely into our new stadium, and, granted, when he came in the whole place was given a lift and even the most cold-hearted of Evertonians must have revelled in the sentimentality of having a previously much-loved manager guide us through the farewell to Goodison.
But many of the frustrations we voice today appeared before the end of last season. There were a few poor results hidden amongst the emotion and relief, as well as plenty of questionable, scarce and late subs to boot. However, he was perhaps spared some of the harsher criticism because he only managed half the season.
For this reason, I’d like to compare this season, in which he’s been in charge throughout, to 2023/24; Sean Dyche‘s only full season in charge.
DISCLAIMER: I am not suggesting we should’ve kept Dyche, nor am I suggesting the football was good – I’m just making a point!
| Metric | 2023/24, Dyche | 2025/26, Moyes |
| Points | 48 | 49 |
| Position | 12 | 13 |
| Goals | 40 | 47 |
| Goals Against | 51 | 50 |
| xPoints | 53.1 | 46.17 |
| xG | 60.75 | 49.87 |
| xGA | 60.26 | 59.99 |
| Deserved Position | 10 | 14 |
| Squad Value (Euros, m) | 391.75 | 450.45 |
| Wage Rank | 10 | 12 |
Though almost identical in terms of points and league position, the underlying performance metrics paint a far more favourable picture of the 23/24 season under Sean Dyche. As well as having to deal with the many adversities around the club at this time, including points deductions, transfer market difficulties and all the nerves and anxiety around the ground, Sean Dyche was consistently let down by his strikers to a greater extent than any other manager.
We should’ve scored a whopping 20 more goals than we did, and almost 11 more than Moyes’ 25/26 team, based on chances created. Dyche’s side also deserved to pick up almost 7 more points than Moyes’, and should’ve finished (barring points deductions) in 10th, directly in line with wage expenditure… AND… he did it with a much weaker team, worth around 60 million euros less than Moyes’. No Iliman Ndiaye, no Kiernan Dewsbury-Hall, no Jack Grealish, yet way more chances and way more expected points.
Now, if you haven’t stopped reading yet, I ask: if we want stability and to get the best out of the (limited) resources we have, isn’t Dyche a better fit than Moyes? One gets the team performing in line with (and, at times, better than) expectations; one is given more resources but performs worse. How do you think the fans would react to some of the drivel served up at times this season if Dyche were at the helm? No sentimentality involved, no past credit in the bank and no nonsense – I’d guess we’d be hounding him out.
If I may propose one more thing without backing it up with numbers: we mightn’t have seen our team throw away so many goals – and games – from corners at the end of this season.
All things considered, we haven’t moved forward this season. Reading into the message from Angus Kinnear, stability appears to be the name of the game; it certainly appears to be one of the main arguments levelled by pro-Moyes supporters on social media. Even among the most ambitious of Evertonians, stability is not to be sniffed at. A few years ago, I’d have bitten your hand off for it. But a few years ago, we were in a very different place from where we are now.
Look at the trends presented above. Don’t the last 3-4 years represent stability, at least in a performance capacity? If not, how many more seasons of staying where we are do supporters want before they’d dare to be bold and demand more? How long do the numbers have to flatline before we want to see them increase? How many smaller clubs than us do we want to see win trophies and compete in Europe before we say “enough’s enough”?