duncs pigeon
Player Valuation: £35m
@EverTheOptimist likes thisVery RAWK.
@EverTheOptimist likes thisVery RAWK.
You are correct and this year their actual goals are slightly exceeding their expected and they are doing better in the league.Brighton were xG kings last season. I can remember people saying all they needed was a striker...
The point of stats like xG is to tell a better story about what happened, and therefore predict with greater accuracy what will happen going forward. The idea is that not all shots, saves and shots on target are created equal. A tame effort hit directly at the keeper from 20 yards out counts the same in those stats as a ball from eight yards that the keeper makes a wonder save to keep out.I’m not really bothered.
it all feels very “FIFA” generation to me.
Goals, Shots on Target are your indicator of how well you should have done in a game in an attacking front.
So far the stat suggests they're creating fewer chances, but finishing the ones they get.Brighton were xG kings last season. I can remember people saying all they needed was a striker...
Smacks of all their idiotic 'alternative' tables doesn't it ?
To start with it was literally where the shot was taken from (the closer to goal and more central the higher the value) and the body part (head or foot).Understand that the better the XG, the better the chance, but who actually puts a number to that, and how do they work it out? Eg how is it quantified
Wow, didn’t know that, nice one ??To start with it was literally where the shot was taken from (the closer to goal and more central the higher the value) and the body part (head or foot).
It was calculated by taking the coordinates of a shot (and body part used) from hundreds of thousands of logged shots and saying if a goal was scored or not. So if 100/1000 shots were scored from that location then that equals a 0.1xg shot.
That did actually work, teams that got better shots from better locations score more goals.
However that had obvious problems, there is a huge difference between a shot into an empty net from 20 yards and a shot from 12 yards with 10 defenders in the way, but the "naive" model would rate the open goal shot as harder.
So then some providers added in where the shot was placed (called post-shot xG) which took into account goalkeeper position and where the shot went.
Now some take snapshots that plot where the defenders were positioned when the shot was taken which makes it more accurate on a game by game basis.
Every club uses xG to some extent but it is normally part of a package of stats used to monitor performance. It is just new terminology for "we had the better chances" to be honest.
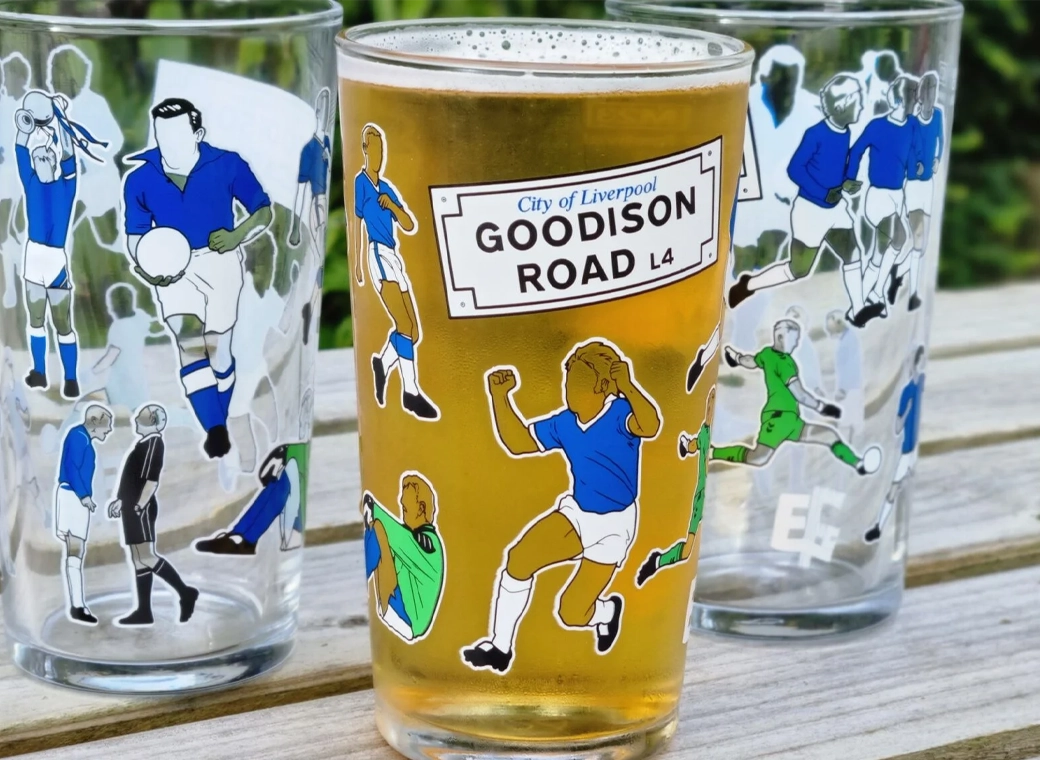
Our exclusive Everton pint glasses are a true collector’s item that pays homage to Goodison Park through iconic players who have graced the pitch over different generations.
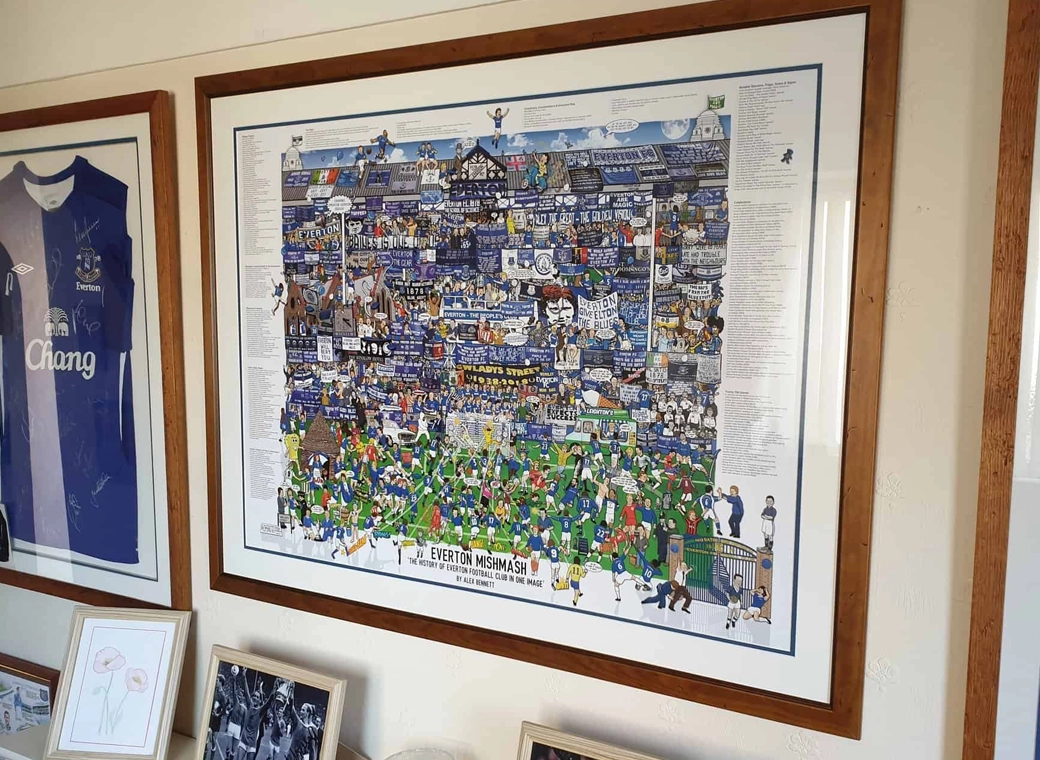
The history of Everton FC in one image! “The best Everton thing I’ve ever got!”

A truly, wonderful piece which brings memories of visits to Goodison Park alive.

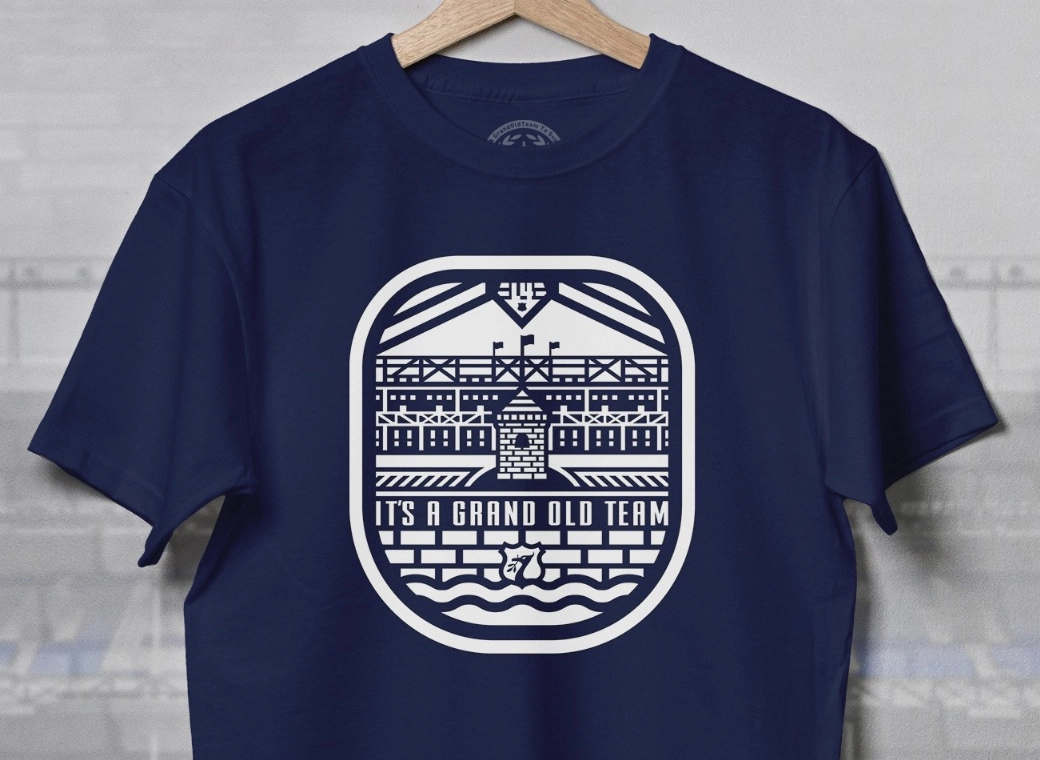
This print wonderfully encapsulates the magic of the ‘Goodison Under The Lights’.
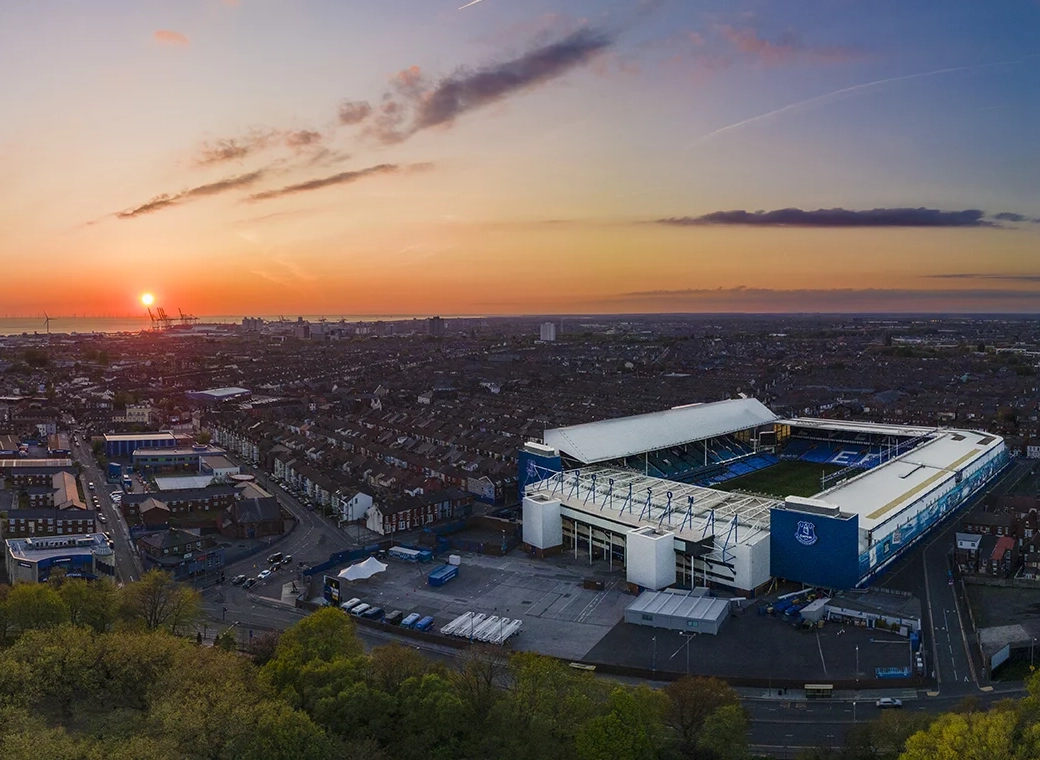
A wonderful, A3 aerial print of Goodison Park.
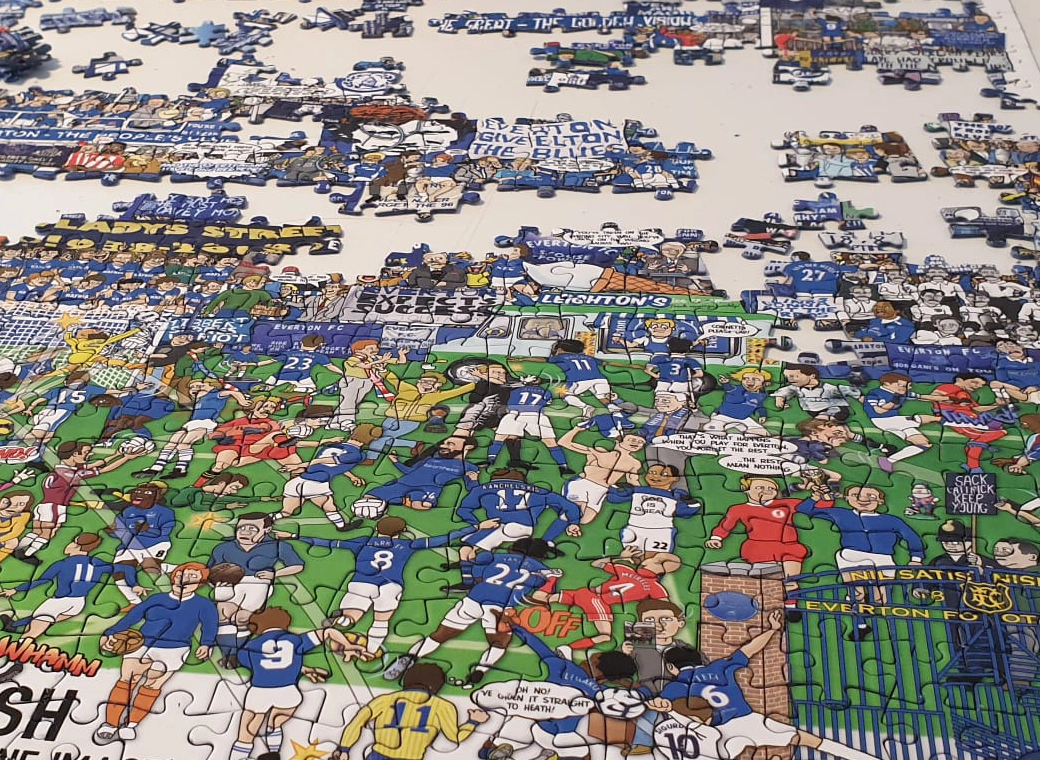
A special, limited edition 1,000 piece jigsaw of the popular Everton Mishmash – The History Of Everton FC In One Image!
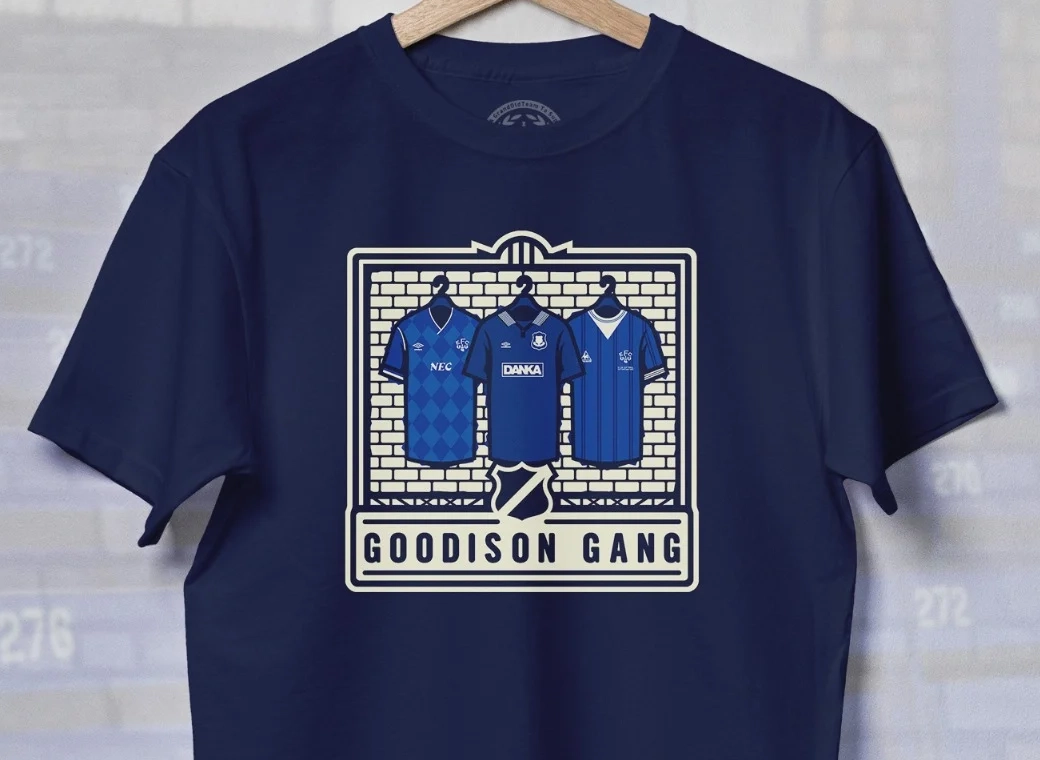
Introducing our Goodison Gang Everton T-Shirt.
Our newest Everton T-Shirt.
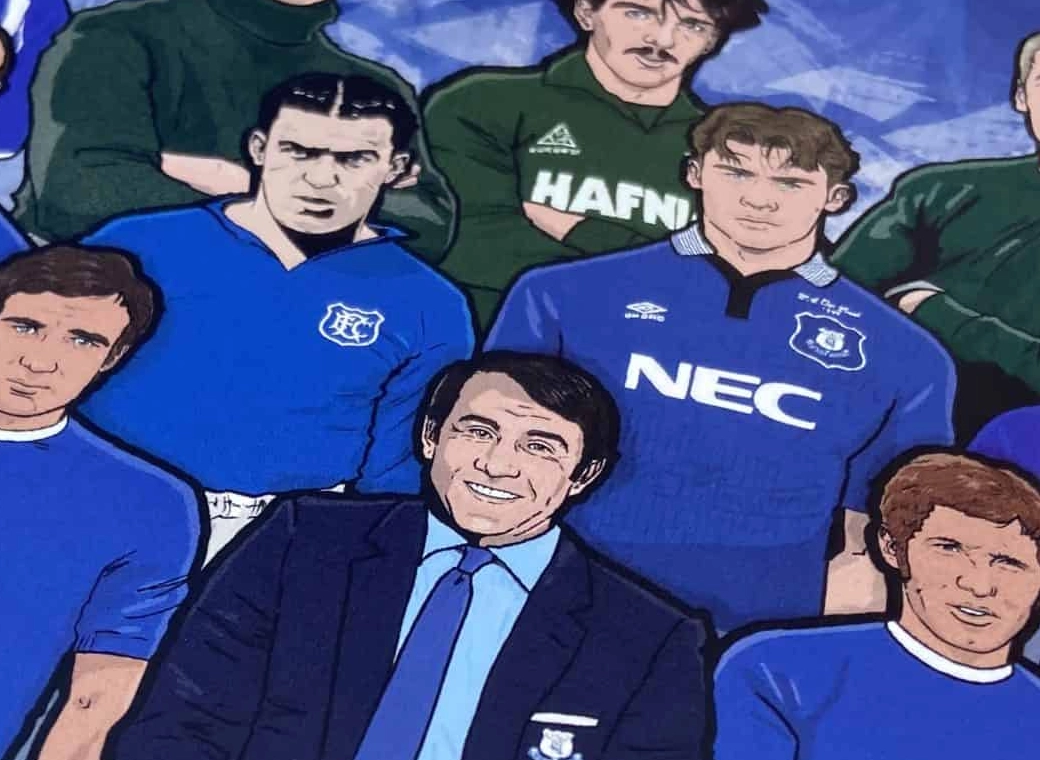
Everton champions, legends, and long-time servants assembled together in one squad photo!
")