You are using an out of date browser. It may not display this or other websites correctly.
You should upgrade or use an alternative browser.
You should upgrade or use an alternative browser.
Pythagorean Points (Updated periodically)
- Thread starter just_COYB
- Start date
- Status
- Not open for further replies.
I didn't sine up for this
just_COYB
Player Valuation: £8m
Well I wrote it cos I was interested, that's all.I didn't sine up for this
I secant this sentimentI didn't sine up for this
Would it help if the pitch was triangular ?
Your post just gave me a 'nam style flashback of A-level maths.I secant this sentiment
Neat.
The table is reality. This gives a better glimpse into what can be predicted for the future. Based on current form, some teams should even upwards towards their mean, while others will drop.
This can often be told just by watching, but the numbers can back up what is being observed, or sometimes contradict it to make one look deeper.
I don't see this sort of thing as necessarily saying Team X should be higher up than they are - results are results, but it can show how some teams have more 'luck' than others, or that a team is expected to tail off considerably if they continue in current form.
I.E. if Chelsea continue to play as they have been, they would be expected to lose some matches or have some more draws - obvious in that extreme case, but the interesting bits (to me) are in the finer grain numbers.
It's not for everyone, but it legitimately has a place to assist in the understanding of reality. It's kind of what math(s) does.
just_COYB
Player Valuation: £8m
Neat.
The table is reality. This gives a better glimpse into what can be predicted for the future. Based on current form, some teams should even upwards towards their mean, while others will drop.
This can often be told just by watching, but the numbers can back up what is being observed, or sometimes contradict it to make one look deeper.
I don't see this sort of thing as necessarily saying Team X should be higher up than they are - results are results, but it can show how some teams have more 'luck' than others, or that a team is expected to tail off considerably if they continue in current form.
I.E. if Chelsea continue to play as they have been, they would be expected to lose some matches or have some more draws - obvious in that extreme case, but the interesting bits (to me) are in the finer grain numbers.
It's not for everyone, but it legitimately has a place to assist in the understanding of reality. It's kind of what math(s) does.
Thanks, I appreciate that, very thoughtful.
B
BBleck
Guest
Oh dear, I can feel this thread going off on a tangentI didn't sine up for this
peteblue
Welcome back Wayne
It may not lie, but it tells you a lot more than just points.
Points win prizes......
This thread is going off on a tangent
I don't think this table is a Shoulda or Coulda. (If I'm wrong, then I apologize and agree with you). This table is a what might we see going forward.Okay, being honest here, I can't ANY difference between the two tables.
Football doesn't work in Shoulda's and Coulda's, it's Humanity that creates and tips the fragile balances within it's own structured ecosystem.
Man.
It's basically a numerical representation of the fact that some teams hit a string of bad luck or form and should improve while others do the opposite. It doesn't tell you what should be (because that's silly). It tells you what might be coming going forward based on the current available data points.
If only there was a way we could change this worrying trend.

- Status
- Not open for further replies.
Shop
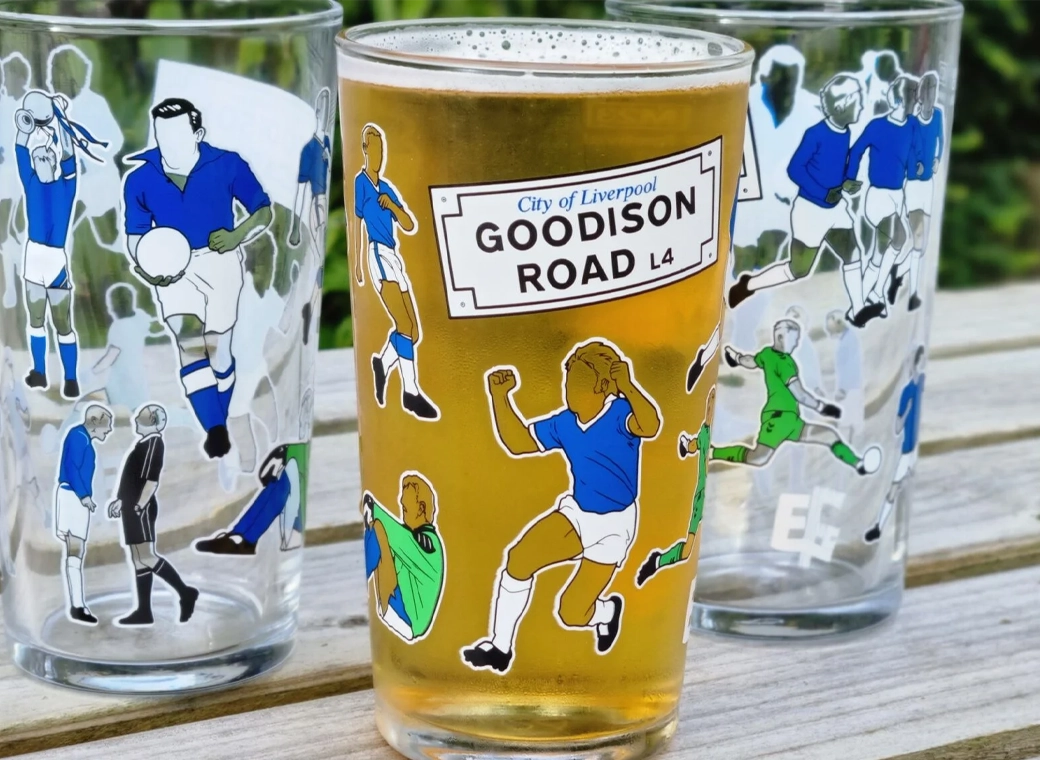
Everton Pint Glass
Our exclusive Everton pint glasses are a true collector’s item that pays homage to Goodison Park through iconic players who have graced the pitch over different generations.
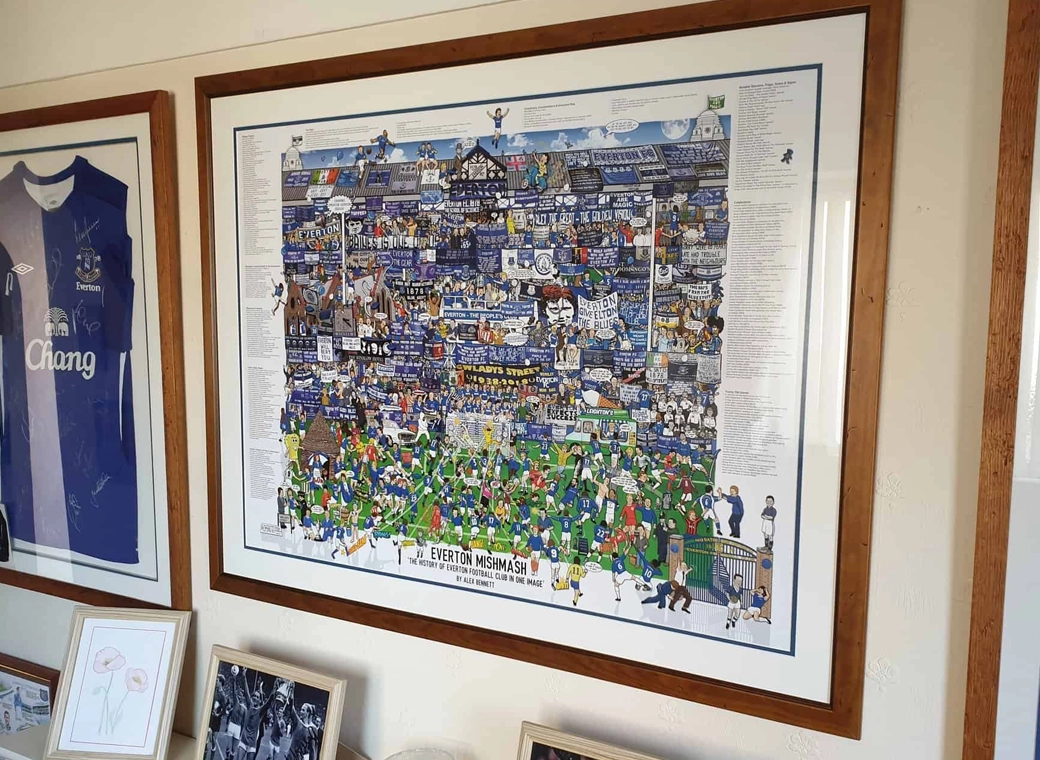
Everton Mishmash
The history of Everton FC in one image! “The best Everton thing I’ve ever got!”

Goodison Park - Blue Skies
A truly, wonderful piece which brings memories of visits to Goodison Park alive.

Goodison Park - Under The Lights
This print wonderfully encapsulates the magic of the ‘Goodison Under The Lights’.
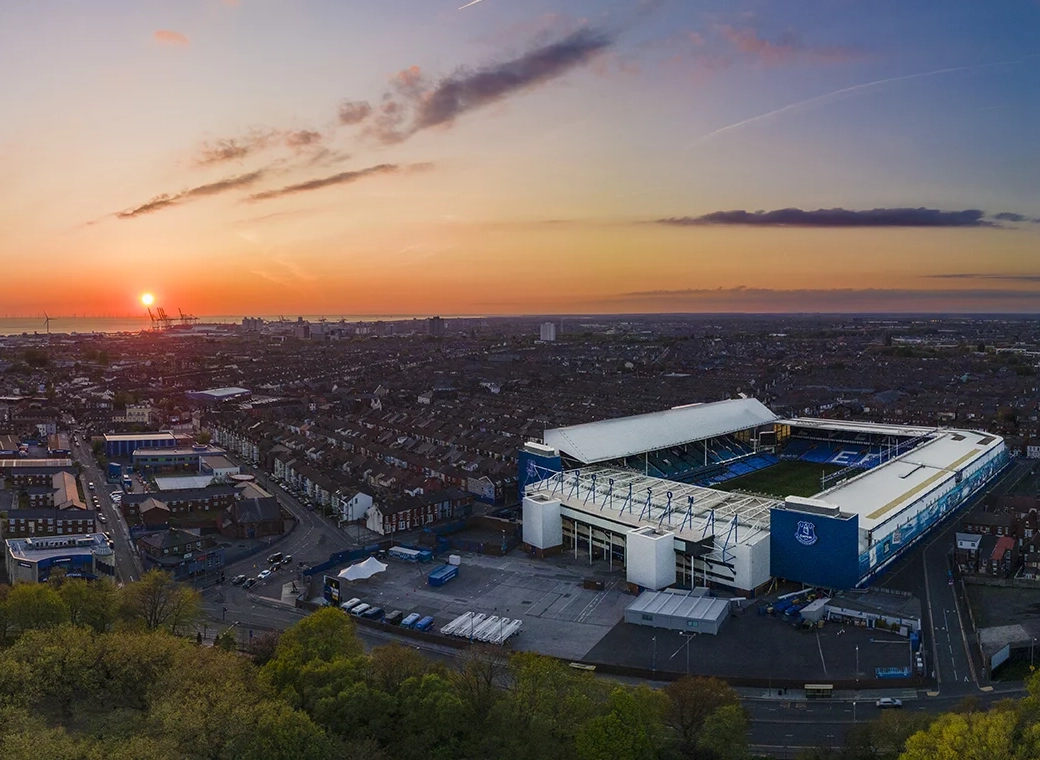
Goodison Park - Sunset
A wonderful, A3 aerial print of Goodison Park.
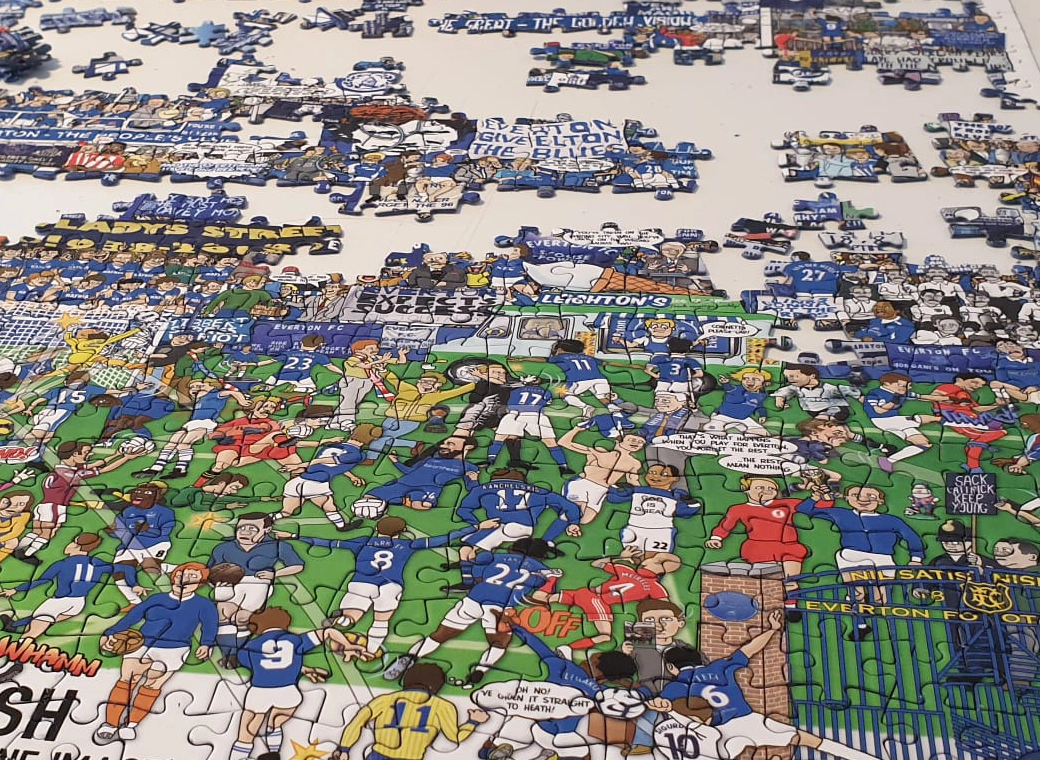
Everton Jigsaw
A special, limited edition 1,000 piece jigsaw of the popular Everton Mishmash – The History Of Everton FC In One Image!
Goodison Gang T-Shirt
Introducing our Goodison Gang Everton T-Shirt.
Grand Old Team T-Shirt
Our newest Everton T-Shirt.
Legends of Goodison Park
Everton champions, legends, and long-time servants assembled together in one squad photo!