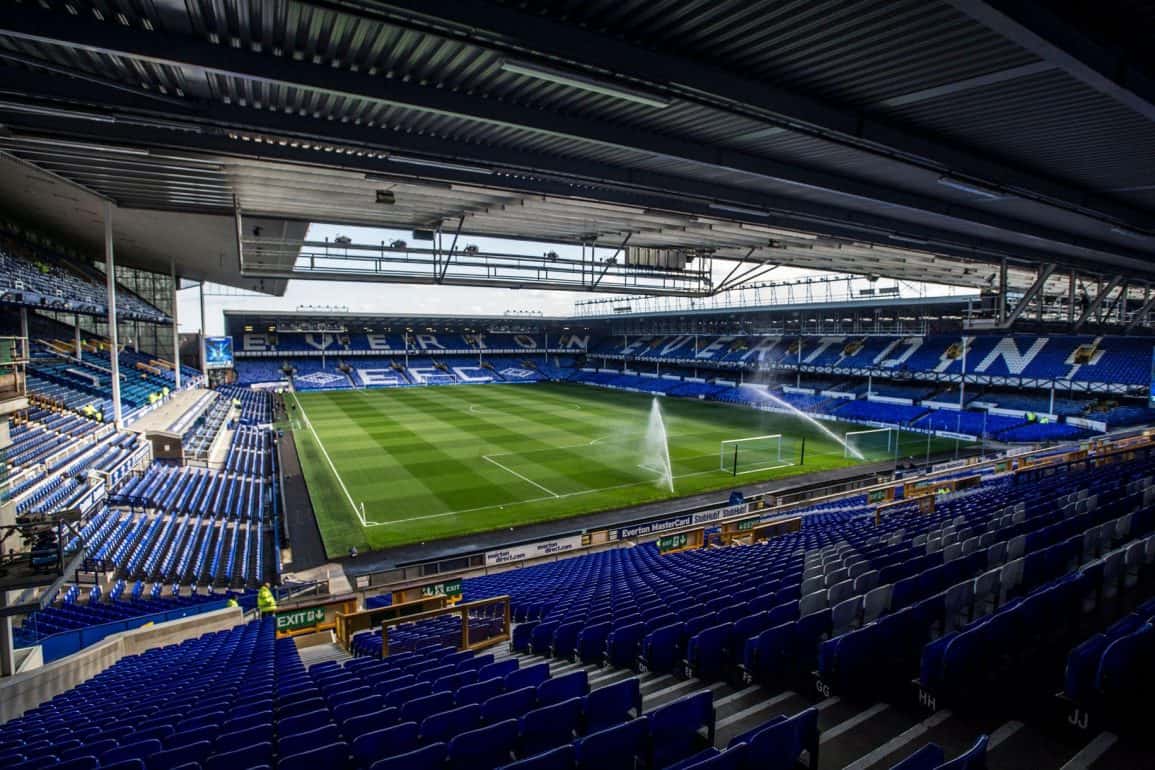
We are perhaps upon the most exciting development this club has had for 20 years. Forget players, forget even the manager or the change of ownership, the potential to build a new stadium, particularly one on the world famous banks of the Mersey represents a unique opportunity. This article is not going to look at the benefits of such a ground (an article should be done on this) but rather crunch the numbers in terms of what we can realistically expect to attract should we move.
What I want to do is focus on our current attendances, then look at what precedents there are historically for clubs increasing their attendance. In a world where Everton are ignored by mainstream media and parodied by our neighbours on our level of support I have tried to look at some statistics to ascertain what is possible. The basis for most of my stats is the average league attendance figure. A trigger warning, this is an article based on numbers, so if it’s not your thing look away now!
The 3 areas to question are primarily where our current attendances stand. Where our support base has ranked historically, through times of success and weakness and finally does such a thing as a “new stadium bounce” really exist. From that I will conclude what capacity we could realistically hope to sell out on a regular basis.
1- Raw Numbers
Over and above any other measurements looking at the raw numbers is critical. It is also probably the most sensible piece of evidence that can be used to justify a more cautious figure for capacity. When you look at the numbers, we have averaged mid to high 30’s for around 20 years. 2003 onwards the average has only dropped below 35,500 for 1 season. The ground is mainly 90% full and on an increasing number of occasions 95% full.
Before that the situation is more volatile. The 20 years before 1996 see the range of averages move between 40k average (1975) to a low of 19.3k (1984). Worryingly for the club the attendances tend to be in a downward correlation in this period. Before that our post war range is between 32k-52k.
The raw numbers indicate, at our most successful in the 80’s we average low 30 thousands. In the 60’s during a successful period it was high 40’s. In isolation it was indicate that a 50k stadium would be ample and underpins why many fans would suggest that as a starting point.
2) Volatility Explained
As indicated above if we just looked at raw attendance data to decide then a 50k capacity would seem sufficient. However I was interested in when our attendances grew and declined and what factors may have contributed to this. To help contextualise this data I have also worked out inflationary pressure across the league. A classic example might be our attendances grow in the 90’s and decline in the 70’s. However these reflect wider trends in football. If our attendance grew by 20% but 10% of people are watching football more generally this should be considered a 9% growth figure. That is the figure in brackets.
The mid 90’s was my starting point for this. Primarily because it is the last moment when you see a big change (rise) in Everton’s attendance and also the last time we won a Trophy. The simple lesson from this of course is if you want to sell a bigger stadium win some trophies!
What we see in Everton’s attendances is there is a decline from 1990-1994 from 26.2k to 22.9k (a 15% drop), yet there is then a big hike between 1994-1996 there is an increase from 22.8k to 35.4k. That represents a 55% increase or when wider league inflation is factored in a (26%) rise.
Likewise in Moyes’s first season in charge, with the excitement of Rooney and a side that finished in the top half for the first time in 7 years the average rose by 15% ( 12%). If we look at other events there is an 8% (6%) rise when winning the league in 1970. In 1962 we see a rise of 24.6% (22%). Or most impressively when we won the league in 1985 we saw a huge rise of 65% (47%). One other interesting date is 1975 where our average grows 13% (15%).
Of the above I have picked out some moments when we won the league, we won the Cup and had an unusually strong league finish. These are all possibilities and give us some figures to base what an increase in attendances could look like. The range of increases are from 6% to 47% when inflation is factored in. For the figures we are using that would mean an average crowd of anywhere from 41000 at the smaller end to 58000 at the bigger end. A cup win like Royle had may see a figure of around 50k.
All numbers worth considering and more importantly all numbers not based upon the excitement of a new ground. It is my own personal view that if capacity or obstructed views weren’t an issue we would cautiously average close to 45k. If you use that as your original starting point the numbers range from 48k at the smaller end, to a cup win 56k and an 85 league win increase putting us 67k.
There have been declines in our history too. The early 90’s saw a decline of 15% and when considering the wider rises in attendance this equates to 27%. A figure that is almost identical with what the 2 years of Royle reversed. Relegation in the 50’s and decline from 77 to 83 hit the club hard. However if we are to be positive and want to grow the brand there are lots of evidence for optimism in terms of growing the clubs fan base.
3) New Ground Boost
Much talk of a new ground is that for whatever reason there is an increase in attendances. Build it at they will come is one of the most over used clichés for business but I wanted to look closer. I analysed Arsenal, Middlesbrough, Derby, Southampton, Huddersfield & Sunderland.
For whatever reason what is shown with all of these clubs is a dramatic increase once a new ground is built. Arsenal show a 57% increase, Sunderland 57%, Southampton 100%, Derby 61%, Huddersfield 84% & Middlesbrough 55%. All of the increases are overwhelming and given our current stats would be evidence to show our increase could be expected to be around 60k at the smaller end to 78k at the implausibly larger end.
There are some caveats to this. Most of the clubs in question were enjoying a period of relative success for them. Arsenal are winning leagues while Derby, Sunderland, Middlesbrough & Huddersfield promotion to a higher division. In the case of Southampton they had a ground that was just too small for them and the original figure of 15k was just too low. However in quite a wide sample there is evidence to suggest a new ground sees an increase in and of itself and the level of increase based on our underlying stats would suggest 50k would just be too small.
4) Our Standing relative to other clubs
As we live in the sky era a common complaint for Everton fans is that our history prior to 1992 is discarded. The fact there was a debate, never mind a debate that saw Southampton as winners about who was the bigger club of Southampton and Everton was insult enough. To try and understand what is a realistic aspiration for our attendances, routing that in not only our own historic data but also where we compare to the rest of the league I thought relevant.
There have been 9 clubs who have been the best supported since the formation of the game. These are, Everton (13 times), Liverpool (7), Manchester City (3) & United (47), Spurs (6), Arsenal (11), Chelsea (9), Aston Villa (6) & Newcastle (7). Manchester United now dominates in terms of being the best supported team and post 1965 only Liverpool have overcame them. The last team before that was Everton in 1965 & 1964. However was is striking is we are second highest in that list.
What also becomes apparent is that up until the turn of the 20th century we consistently remain one of the best supported teams. Before 1999 we are only outside of the top 7 supported teams on 21 occasions but 14 seasons out of the 16 seasons that followed. The same method applied to Liverpool & Manchester United fall outside of the on 22 & 34 times respectively (albeit with a far heavier concentration in the pre-war era).
A lot of this is down to other clubs stadia overtaking our own at the turn of the last century but this also reinforces the point that we need to aim for a stadium that allows us to rank inside the top 6 or 7 teams. Over the forthcoming period we are likely to see ground sizes of Manchester United 75k, Liverpool 54k, Manchester City, Spurs, Arsenal- 60k, West ham 56k and Chelsea 60k. If we limit our stadium to 50k we will be 8th on that list and forego a big opportunity to be amongst the best supported teams in the division.
What is our Range
One final comparison I felt interesting was seeing where we ranked, from highest to lowest average in comparison to the rest of the league. Our lowest position has been 12th (1976 & 1953) while our highest is 1st. This is a remarkably small range given we have been relegated and had to survive in the same city as one of the most successful clubs in Europe and up the road from the most successful club in Britain. Even in division 2 in one season we had the 4th highest attendance. In 2016 this would mean averaging over 50k in the championship for a like for like comparison. Put simply, however much adversity has been thrown at Everton we remain one of the best supported clubs in the country.
When I looked at other clubs, nobody could match such a tight range. Arsenal ranged from 1-13th, Liverpool 1st-20th, Manchester United 1st to 33rd, Spurs 1st to 16th. In defence of Liverpool and Manchester United if we looked at post war Britain their ranges are 1-12 (Liverpool) and 1-9 (Manchester United). It again shows that we remain one of the consistently best supported teams even when measured against the very biggest.
When we drop down a level we see Chelsea range from 1st-28th, Manchester City from 1st to 34th, Aston Villa from 1st to 25th, Leeds from 3rd to 37th, West Ham from 6th to 36th, Sunderland from 11th to 53rd and Southampton from 12th to 53rd. These are often teams we are directly compared to in the wider media in terms of size of club, but again we can see our historical attendance figures are in a different league to any of those clubs. I am not trying to run down other clubs but give a reflection of where we are positioned in terms of support base.
Conclusion
In my life I suffer from 3 afflictions, one is to be born an Evertonian, secondly to be a keen mathematician and finally to be an optimist. All of those skills I have tried to put into this article. Statistics can be used in a variety of ways and this is by no means meant to be a factual case of what our ground capacity should be, but to pose some questions and question the notion that using current attendance figures alone should be used to decide capacity size.
There is a subjective factor in there too though. For years we have been told by the media to our loving neighbours of how we are not a big club. Often sneering comments about the 11k against Coventry in the early 80’s is thrown up without a wider contextual understanding of the deflationary pressures on fan attendance through that era. The same can be said about the average of 32k when we won the league. It is lower than today but was around 65% higher than the league average for that season. There is no doubt though that over time those ideas will gain a foothold within our fan base. This is a riposte to these ideas and a defence of our size and potential.
The story of Everton is the story of a club that was amongst the biggest up to 1970 but subsequent to that moment went into decline. There was a brief resurgence in the 80’s but not enough was built off the back of that. However there is also a unique resilience of the fanbase. No trophies in 21 years and regularly being in the shadows of our neighbours shadows has never seen the fan base decline as it has with many other clubs.
In most businesses had they have had two local competitors conquer the market so close to them in the manner Liverpool FC and Manchester United have over the last 45 years. It is testament in part to the resilience of Evertonians that we have not buckled under their success. Part of this is the resilience of Evertonians and the never say die spirit that exists within the city of Liverpool itself. Part of it is reflective of good work the club has done. I would hypothesise that the decline would have been more sharp over the last 15 years had the club not done more work in the community and actively targeted younger fans with incentivised pricing. There is a legitimate question to ask, if we can remain one of the better supported teams in lieu of any success, what are the limits if we were successful?
In rounding it off we are left with what the central question of what should we go for with our capacity. We are selling out most weeks and have been filling the ground most weeks for 2-3 years now. While guesswork if obstructed views and capacity weren’t an issue I suspect our average would be cautious 45k. Given a cup win could generate an addition 26% or a competitive finish another 10% it would suggest an average of around 50-55k is realistic. This is without any bounce from a new Stadium or the likely continued inflation and increase in people watching the Premier League.
If possible the aim should be to have a stadium that holds at least 60k. Ideally it would be 65k with the opportunity for expansion. The biggest mistake the club made in the mid 90’s was not finalising a ground move and allowing for the post Cup win momentum to grow further. A competitive team, a state of the art ground and the initial boost of a new Stadium would suggest that an average of 60k is more than plausible. It would also put the club back where it has always been, amongst the best supported in the country.
Footnote: all stats gathered from below website.
http://european-football-statistics.co.uk/attn/nav/attnengleague.htm